
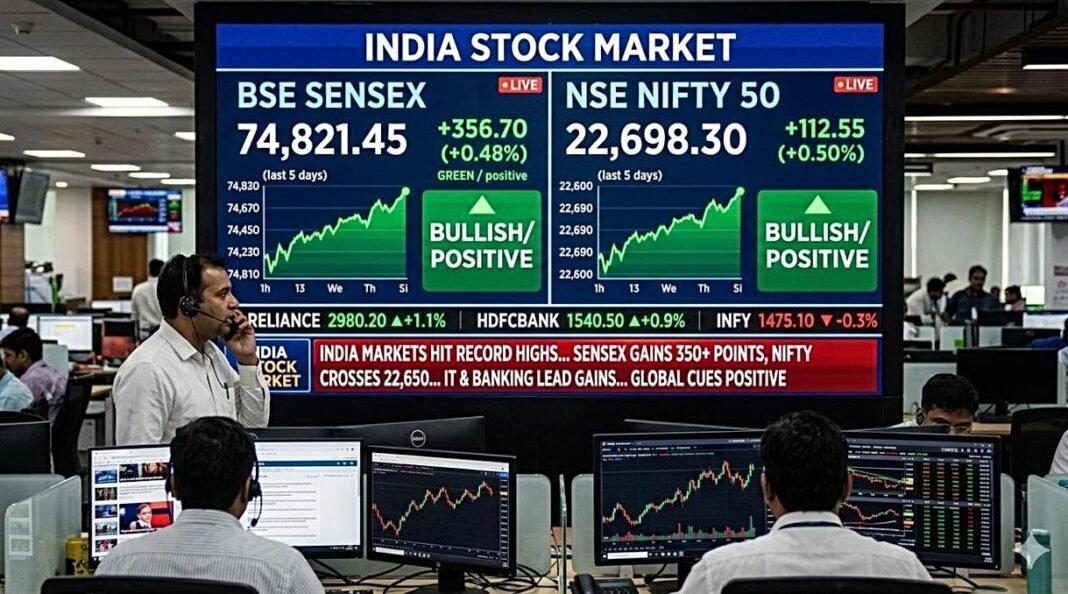


The Indian stock market rose for a fifth straight session on Wednesday, 4 November, with both main benchmarks closing at two-month highs. The Nifty gained 0.63 percent to close at 23,960.60, up from 23,810.85 in the previous session. The Sensex rose 0.5 percent, adding 383.55 points to close at 77,301.40, up from 76,917.85. The morning report pointed to optimism in the United States as a supporting factor for the gains in Mumbai.
Indian stock market gains extend to five sessions
A run of five straight higher closes in the Indian stock market gives traders a clear sequence to read. Each session in the run added to the level of the two benchmarks, and Wednesday kept that sequence intact. The Nifty added about 150 points on the day, based on the difference between its previous close of 23,810.85 and its close of 23,960.60. The Sensex added 383.55 points, moving from 76,917.85 to 77,301.40. Percentage gains give a second way to read the same move. The Nifty rose 0.63 percent, while the Sensex rose 0.5 percent. The two measures do not move by the same amount on every day, because the two indices cover different sets of stocks and use different methods to weight them.
Two-month highs in the Indian stock market are a simple marker. They mean the closing levels on Wednesday were higher than any close in the previous two months. That marker does not by itself say where prices will go next. It does say that, on this measure, the Indian stock market benchmarks ended the day above the range they had traded in for the past two months. Readers who follow the market day by day often note such markers, because they show whether a recent run has carried prices beyond recent closing levels.
What the Nifty and Sensex closes show
The Nifty and the Sensex are the two headline indices most often quoted for the Indian stock market. The Nifty tracks 50 large companies listed on the National Stock Exchange. The Sensex tracks 30 large companies listed on the Bombay Stock Exchange. When both indices rise on the same day, the gain is broad at the level of large companies, at least in index terms. When they move in different amounts, as they did on Wednesday, the gap reflects the different stocks in each index and the weight given to each stock.
Points and percentages answer different questions. Points show how much an index level moved. Percentages show how large that move was relative to the starting level. A gain of 383.55 points on the Sensex and a gain of about 150 points on the Nifty look very different in points, because the two indices start from very different levels. In percentage terms, the moves were closer: 0.5 percent for the Sensex and 0.63 percent for the Nifty. Percentage change is the usual way to compare moves across indices that sit at different levels.
Indian stock market mood and United States optimism
The morning report cited optimism in the United States as a factor behind the gains. Global mood often matters for Indian equities, because large investors watch conditions in the United States alongside conditions at home. A stronger mood in the United States can coincide with buying in other markets, including India. The report did not present this as the only factor at work. It named United States optimism as a cited reason for the rise, and the closing numbers themselves give the size of the move that followed.
Wednesday was the fifth session in a row to close higher. A sequence of that length in the Indian stock market is worth noting because it shows buying held up across several days, rather than appearing for a single session and then fading. At the same time, a five-session run is a record of past closes. It does not fix the direction of the next session. Each new session starts with fresh orders, fresh news and fresh trading, and the next close will depend on trading on that day.
Reading the two-month high marker
A two-month high in the Indian stock market is a backward-looking marker. It compares the latest close with closes over the past two months and records that the latest close sits above them. It is used in reporting on the Indian stock market because it gives readers a quick sense of where the current level sits in recent history. It is not a forecast. Prices can move back below a recent high in the next session, and they can also move further above it. The marker only records what happened up to the close on Wednesday.